2026 Best Metal Technologies Locations for Global Buyers?

Choosing the best metal technologies locations for global buyers requires more than comparing factory prices. Buyers must examine production depth, energy reliability, transport access, skilled labor, and supplier transparency. The World Steel Association reported approximately 1.89 billion tonnes of global crude steel production in 2024. That scale shows strong industrial capacity, but it does not guarantee advanced machining, additive manufacturing, alloy development, or dependable quality control.

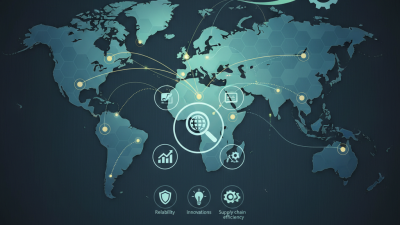
The International Energy Agency’s Global Critical Minerals Outlook 2024 highlights continuing concentration in mineral processing and refining. This concentration can create exposure to shipping delays, policy changes, and unexpected price movements. A location with nearby ports may still depend on distant sources for nickel, cobalt, rare earths, or high-grade graphite. That detail matters. Buyers should map the complete material route, from mine and refiner to certified processor and final assembly plant.

Regional strengths differ. Germany and Italy offer deep engineering networks and precision manufacturing experience. The United States provides strong research infrastructure, aerospace expertise, and growing domestic investment. Japan and South Korea remain influential in specialty materials, electronics, and high-performance components. China has unmatched scale across many metal-processing segments, although buyers must assess supplier resilience carefully. India, Vietnam, and selected Eastern European markets are gaining attention for cost-efficient manufacturing and expanding technical capacity.

Cost alone misleads. Data can lag reality. Buyers should verify certifications, audit records, energy sources, delivery performance, and workforce stability directly with suppliers. The World Bank’s Commodity Markets Outlook also warns that commodity prices remain sensitive to energy costs, trade conditions, and geopolitical developments. Therefore, the strongest metal technologies locations in 2026 will be those combining technical capability with measurable resilience, traceability, and realistic contingency planning. No location is perfect. The best choice depends on the buyer’s alloy, tolerance, volume, compliance needs, and risk appetite.
2026 Best Metal Technologies Locations for Global Buyers?

Define “Best” by Cost, Capacity, Trade, and ESG Metrics from WSA and IEA

2026 Best Metal Technologies Locations for Global Buyers?

Define “Best” by Cost, Capacity, Trade, and ESG Metrics from WSA and IEA

The best location is not always the lowest-cost producer. Buyers should compare landed cost, production capacity, delivery reliability, and energy exposure. A low factory price can disappear after ocean freight, port handling, insurance, and currency changes. Cheap is not enough.

Capacity data from the World Steel Association can reveal whether a region supports stable supply during demand peaks. Review output trends, utilization rates, maintenance patterns, and available technology. A modern electric furnace may offer flexible production, but its performance depends on scrap quality and grid stability. Ask for recent operating evidence, not only investment claims.

Trade analysis should include tariffs, customs procedures, route congestion, and regional agreements. ESG review needs equal discipline. The International Energy Agency provides useful context on power systems, emissions, and clean-energy development. Compare emissions per tonne, renewable electricity share, water use, and material recovery. These figures need local verification. Data can mislead.

Site visits remain valuable. Inspect storage yards, testing laboratories, safety controls, and dispatch records. Speak with technical staff, not only sales teams. A location with strong capacity may still struggle with traceability or environmental reporting. Buyers should also test how suppliers respond to a failed shipment or an unexpected energy-price increase. No ranking stays accurate for long.

2026 Best Metal Technologies Locations for Global Buyers? — Define “Best” by Cost, Capacity, Trade, and ESG Metrics from WSA and IEA

Location 2024 Crude Steel Output
(Mt, WSA)
Supply Scale Buyer Cost Signal* Trade Position** Energy & ESG Transition Signal*** Best-Fit Buyer Profile
China ≈1,005.1 Very high Medium Large net exporter Medium; rapid clean-energy scale-up Large-volume procurement, broad product ranges, and diversified industrial supply chains.
India ≈149.6 High growth Low to medium Mixed; growing export capability Medium; strong renewable expansion with high coal dependence Growth-oriented buyers seeking expanding capacity, competitive conversion costs, and long-term partnerships.
Japan ≈84.0 High High Export-oriented High; advanced efficiency and decarbonization programs Quality-sensitive buyers requiring advanced grades, process consistency, and dependable export logistics.
United States ≈79.5 High High Large net importer Medium to high; significant low-carbon electricity potential Regional buyers prioritizing traceability, recycled-metal routes, domestic delivery, and regulatory alignment.
Russia ≈71.5 High Low to medium Export-oriented Medium; relatively carbon-intensive power mix Cost-focused buyers able to manage sanctions, payment, insurance, and logistics constraints.
South Korea ≈63.6 High High Export-oriented Medium; high efficiency with decarbonization pressure Technology-intensive buyers needing high-grade flat products, automotive materials, and reliable shipping.
Germany ≈37.2 Medium High Export-oriented High; strong climate policy and industrial decarbonization focus EU buyers prioritizing low-carbon procurement, product certification, and short-distance delivery.
Türkiye ≈36.9 Medium Low to medium Export-oriented Medium; electric-arc-furnace base with fossil-heavy power Buyers seeking flexible order sizes, proximity to Europe and the Middle East, and strong rebar availability.
Brazil ≈33.7 Medium Low to medium Export-oriented High; comparatively renewable electricity system Buyers balancing raw-material access, Atlantic logistics, and lower-carbon sourcing potential.
Iran ≈31.0 Medium Low Export-oriented Low to medium; high fossil-fuel exposure Price-sensitive buyers with established regional logistics and the ability to manage trade restrictions.
Methodology and sources: Capacity is represented by 2024 crude steel output and is not a claim about unused production capacity. The buyer cost signal is a comparative screening indicator based on energy exposure, raw-material access, industrial scale, and logistics—not a quoted transaction price. Trade position summarizes recent country-level steel-trade patterns and should be verified for the specific product, grade, and destination. The energy and ESG transition signal is a country-level indicator reflecting electricity-system characteristics, energy-transition progress, and industrial decarbonization direction; it is not a plant-level emissions certification. Production figures are rounded from the World Steel Association, World Steel in Figures 2025. Energy and transition context is based on the International Energy Agency, World Energy Outlook 2024 and related IEA electricity and clean-energy datasets. Trade classifications should be checked against current UN Comtrade data before contracting.

Map Major Hubs Using WSA’s 1.88-Billion-Ton 2024 Steel Output Data

For global buyers, steel geography begins with verified output, not promotional maps. The World Steel Association reported 1.88 billion tonnes of crude steel production in 2024. China produced about 1.005 billion tonnes, exceeding half of global output. India followed with approximately 149.6 million tonnes, while Japan, the United States, Russia, and South Korea formed additional major production centers.

These figures point to different sourcing strengths. China offers exceptional scale across integrated mills, flat products, and downstream fabrication. India is expanding capacity and may suit buyers seeking growing regional supply.

Japan and South Korea remain important for consistent quality, advanced processing, and export connectivity. The United States supports high-value manufacturing networks, especially where electric-arc production and recycling are practical. The locations matter.

However, output alone cannot identify the best technology partner. The OECD’s recent steel-market reviews highlight persistent overcapacity, changing trade flows, and uneven demand. Buyers should compare mill-level certifications, furnace type, energy sources, port access, lead times, and carbon intensity.

A large hub may still create delays during congestion or policy changes. This is where the map becomes imperfect. I would also avoid treating national totals as technology rankings; production data measures volume, not reliability, product tolerance, or after-sales engineering. Site audits and recent shipment records remain essential before contracting.

Compare China, India, Japan, and the U.S. by Production and Export Scale

For global buyers, steel remains the clearest benchmark for comparing metal technology locations. The World Steel Association’s World Steel in Figures 2025 reports 2024 crude steel output of about 1,005 million tonnes in China, 149 million in India, 84 million in Japan, and 79 million in the United States. Scale matters. It supports larger melt shops, broader supplier networks, and faster qualification of standard grades.

China offers unmatched production depth and the widest export capacity among these markets. India is expanding rapidly, with strong growth potential and competitive large-volume manufacturing. Japan produces less steel, yet its mature process control supports demanding automotive, precision, and specialty applications. The United States combines substantial output with advanced automation, energy infrastructure, and strong domestic demand. Costs can be higher.

UN Comtrade 2024 records for HS 72 and HS 73 show China and Japan leading these four economies in steel-related export value, while the United States and India remain important but more selective exporters. These figures need careful reading. Product mix, exchange rates, and intra-company shipments can distort simple rankings. A buyer seeking low-cost commodity steel may prioritize China or India. A buyer requiring tight tolerances may value Japanese or American process capability more. Location alone is not enough. Factory audits, mill certificates, testing records, delivery history, and total landed cost still decide the practical choice.

2026 Best Metal Technology Locations for Global Buyers

Comparison of China, India, Japan, and the United States by crude steel production and steel product export scale.

China offers the largest manufacturing and export scale, while Japan and the United States provide mature industrial ecosystems. India combines rapidly expanding production with a smaller export base. Production figures represent 2024 crude steel output; export figures represent rounded 2024 steel product export volumes.

Sources: World Steel Association, “World Steel in Figures 2025”; national customs and steel industry trade statistics. Figures are rounded and intended for market comparison.

Assess Critical-Mineral Depth: IEA Data Shows China Leads Global Refining

2026 Best Metal Technologies Locations for Global Buyers?

For global buyers, refining depth matters more than a mine’s headline reserves. IEA analysis shows China leads refining for several critical minerals, including graphite, cobalt, rare earth elements, and lithium. Its share often reaches 60% to 90%, depending on the material and processing stage. This concentration affects pricing, delivery schedules, and supply-chain resilience.

A strong 2026 sourcing location should offer more than metal output. Buyers should examine refining capacity, port access, electricity reliability, water availability, and export procedures. Industrial clusters can shorten transport between chemical conversion, component production, and testing facilities. They may also provide experienced technical labor. Still, concentration creates exposure. A power interruption, policy change, or shipping delay can affect many customers at once.

Look beyond capacity figures. Ask how operators verify recycled content, manage hazardous processing residues, and document mineral origins. Independent audits and laboratory certificates improve confidence, but paperwork can hide gaps. I have seen impressive facility profiles with limited evidence on backup utilities or production consistency. That deserves scrutiny. Buyers should compare suppliers across regions, even when one location offers the lowest immediate cost. Availability is not the same as resilience.-cmpr

Rank 2026 Locations with USGS Reserves, Energy, Logistics, and ESG Data

2026 Best Metal Technologies Locations for Global Buyers?

A practical 2026 ranking should combine reserves, energy, logistics, and ESG evidence. The 2025 USGS Mineral Commodity Summaries identifies Chile with about 190 million tonnes of copper reserves. Australia follows with roughly 100 million tonnes and significant lithium and nickel reserves. Indonesia remains essential for nickel, with approximately 55 million tonnes of reserves.

Australia ranks first Its resources are large, port access is strong, and the World Bank’s 2023 Logistics Performance Index placed it 19th globally.

Chile ranks second Chile ranks second for copper and lithium, supported by abundant solar energy. However, water stress deserves serious attention.

Canada ranks third Canada ranks third because of reliable hydropower, established transport networks, and stronger public disclosure practices.

The country placed 17th in the same logistics index. Distance remains a weakness.

The International Energy Agency’s Global Critical Minerals Outlook 2024 warns that mineral refining remains highly concentrated. Buyers should therefore assess processing capacity, not reserves alone. Compare grid emissions, renewable power contracts, water use, tailings controls, and supplier audits. The ranking is imperfect. Data quality varies between countries.

Tips:

Build a weighted score before signing supply contracts. Give reserves 30%, energy 25%, logistics 20%, and ESG 25%. Test the model against a price shock, port closure, or power shortage. A cheap mine can become expensive quickly. Recheck USGS, IEA, World Bank, and national regulatory data annually.